Most projects come in late (and are often over budget), so don’t plan a timeline that is too ambitious. Allow for some slippage, and err on the side of caution. Once you have done this, it is time to plan out the solution.
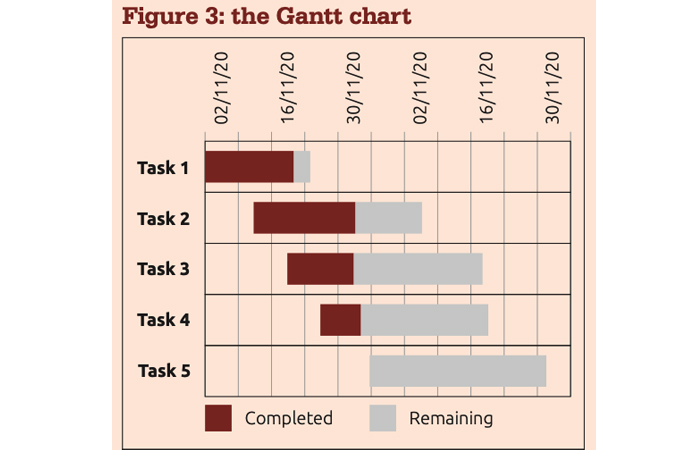
Of all the project management tools, arguably the most useful and the easiest to understand is the Gantt chart (Figure 3). This horizontal bar chart graphically displays the time relationship between the steps in a project. It is named after its inventor, Henry Gantt, an American engineer who pioneered its use in the early 1900s.
To create a Gantt chart, list the steps required to complete a project and estimate the time required for each step. Then list the steps down the side of the chart and the time intervals along the bottom or top. Draw a line across the chart, indicating how long each step will take. Draw your first
line at your start date. The final step will have a line that ends at your planned completion date. In our diagram, the project has five key blocks of work over several weeks.
Often, key blocks of work will overlap and can be taken forward together, as in the diagram. It is important, however, to identify blocks of work that require a previous step to be completed in order for the next step to start, as these can be key pinch points in a project.
Having completed your chart, your next question is: Who is going to do each step? When assigning tasks to members of your team, be sure to consider these factors:
- Will – Who wants to doit?
- Skill – Who has the best skills for the task and will work well with everyone else?
- Availability – Who is available to do it?
Once agreed, you can put everyone’s assigned responsibilities on a grid – tasks down the page, people along the top, with a simple X to mark who is doing what. You could put this on the wall alongside your Gantt chart, where everyone can see it.