Painting by numbers
P3 Pharmacy,
09 Jan 2020![]() 2 Min
2 Min
P3 Pharmacy,
09 Jan 2020![]() 2 Min
2 Min
P3 Pharmacy,
09 Jan 2020![]() 2 Min
2 Min
The recently published NHS Digital report on the provision of general pharmaceutical services between 2008-9 and 2018-19 paints a picture that will hold little surprise for pharmacy contractors.
While over the past 10 years the number of community pharmacies has increased from 10,506 to 11,539 – an increase of around 10 per cent – the number of pharmacies in the last two years has declined, albeit not yet in the numbers, or at the rate, predicted by some pharmacy bodies when the pharmacy cuts were introduced.
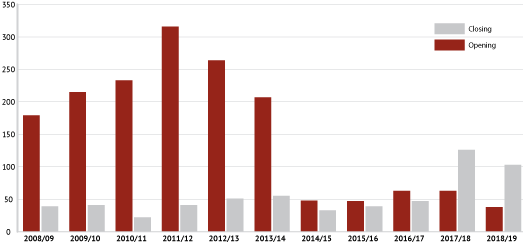
The decline started in 2017/18 when there was a net loss of 80 pharmacies and this occurred again in 2018/19. Looking more closely at the data, in these years too, pharmacies continued to open, although for the first time the number of pharmacies opening was less than the number that closed (see figure 1).
The number of community pharmacies consolidating into a single premises has risen slowly but steadily since regulations were changed in 2016 to facilitate the consolidation of pharmacy businesses from two sites to a single existing site. There were no consolidations to existing premises in 2016-17, but there were 10 in 2017-18 and 28 in 2018-19. Throughout this period, there were no consolidations that resulted in new premises.
The number of community pharmacies consolidating into a single premises has risen slowly
Regulatory changes came into force in December 2016. PSNC said at the time the changes meant new pharmacies “would be prevented from stepping in straight away” where a consolidation leads to one party vacating their premises, offering protection to those seeking to merge.
The current Community Pharmacy Contractual Framework states that the Government and PSNC will seek to “strengthen the protections offered to pharmacies wishing to consolidate… while maintaining fair and open competition and access to NHS pharmaceutical services”.
These efforts will include looking at ways to simplify prescription endorsement requirements and making “administrative improvements” within the Drug Tariff, according to the CPCF.
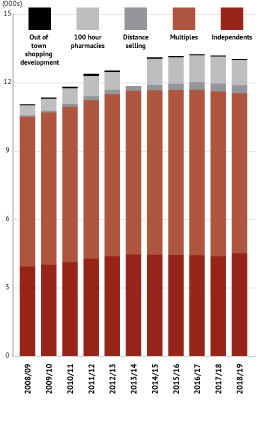
Interestingly, it is the multiples that have been most affected as their numbers declined between 2016-17 to 2017-18 where they fell from 7,265 to 7,233, and again the following year down to 7,014 pharmacies.
Meanwhile the number of independents is bucking that trend with an increase in 139 pharmacies between 2017-18 and 2018-19 reversing a negative trend which started in 2014-15 (see figure 2). Some of the disposals have featured in the news pages in the last couple of years, as the likes of Boots and Lloydspharmacy have offloaded smaller stores. From the data, many have been bought by smaller players and individuals, whose overhead profile can turn a loss maker for one of the big boys into something that works for them.
Of note is that while 100 hour pharmacies have experienced a 147 per cent increase over the 10 years, in the last two years, their numbers have fallen by 77. And, is it possible that we have now reached a state of equilibrium with the number of distance selling pharmacies? Their numbers fell very slightly for the first time in the last year covered by the report.
Item numbers
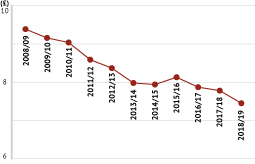
While prescription volume has increased by 30 per cent in the last 10 years, since 2016-17 there has been a small, but nevertheless significant, decline in successive years. Is this trend likely to continue? Meanwhile the average net ingredient cost (NIC) has fallen by 20 per cent over this time, from £9.39 to £7.45 (see figure 3).
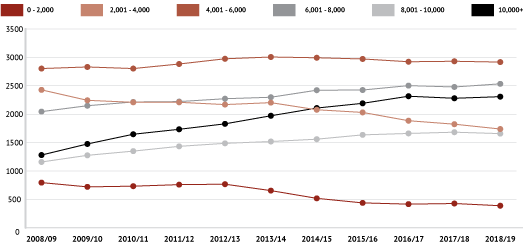
When looking at dispensing volume clear trends become apparent as the number of pharmacies in the lower dispensing volume bands are falling, while the number doing more are increasing (figure 4). Also, within the data it is clear that the number of pharmacies commissioned to provide services (for example, minor ailments, smoking cessation, PGDs, supervised administration) have dropped drastically, which bears out what contractors have been saying for some years. With local council budgets slashed over the past nine years, the numbers here provide clear evidence of the impact of austerity on public service provision.
If the ambitions of the CPCF are to be achieved there needs to be some way of managing the current dispensing volume to enable pharmacies to provide services (if and when they are commissioned), but at the moment the data show that there are fewer pharmacies dispensing more prescriptions for less money, although with signs of a trend reversal in one or two areas that will make next year’s report interesting reading.
We will be examining these trends in more detail on these pages in 2020.